OpenFOAM Version:
OpenFOAM-4.x
| Settings of histogram |
|
1 2 3 4 5 6 7 8 9 10 11 12 13 14 15 |
functions { temperatureHistogram { type histogram; functionObjectLibs ("libfieldFunctionObjects.so"); outputControl outputTime; // outputInterval 10; field T; nBins 10; min 300; max 310; setFormat gnuplot; } } |
| Histogram |
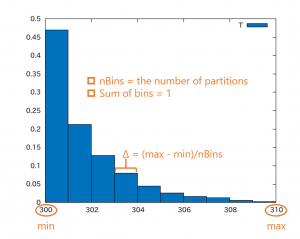
You can create a picture as shown below using Gnuplot with the input file generated by OpenFOAM. I replaced “with lines” with “with boxes” in the input command file to create this picture.
In the above picture, the first bin represents the following volume fraction:
\begin{align}
\frac{\sum_{celli}^{} \left( V_{celli}:\;300 \leq T_{celli} < 301\right)}{\sum_{celli}^{} \left( V_{celli}:\;min \leq T_{celli} < max\right)},
\end{align}
where \(V\) is the cell volume.
