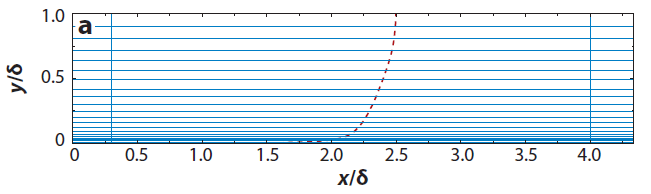
In the case of Detached Eddy Simulations (DES), there are two regions in a computational domain that are treated in RANS-like and LES-like manners. The original Spalart-Allmaras DES model (DES97) formulation is based on the assumption that the wall-parallel grid spacing near the wall is in excess of the boundary-layer thickness \(\delta\) by a good margin so that the entire boundary layer can be handled by RANS [1].
| Settings of DESModelRegions |
In OpenFOAM, we can visually check these regions using the DESModelRegions function objects. It is also available in iconCFD.
|
1 2 3 4 5 6 7 8 9 10 11 12 |
functions { DESModelRegions1 { type DESModelRegions; functionObjectLibs ("libutilityFunctionObjects.so"); enabled true; outputControl outputTime; log true; resultName DESRegions; } } |
If log it true, the volume percent (%) of RANS and LES regions will be output to the screen:
|
1 2 3 |
DESModelRegions DESModelRegions1 output: LES = 62.2455 % (volume) RAS = 37.7545 % (volume) |
| Source Code |
Directory:
OpenFOAM-v1606+/src/postProcessing/functionObjects/utilities/
DESModelRegions
|
128 129 130 131 132 133 134 135 136 137 138 139 140 141 142 143 144 145 146 147 148 149 150 151 152 153 154 155 156 157 158 159 160 161 162 163 164 165 166 167 168 169 170 171 172 173 174 |
void Foam::DESModelRegions::execute() { if (active_) { const fvMesh& mesh = refCast<const fvMesh>(obr_); if (log_) Info<< type() << " " << name_ << " output:" << nl; volScalarField& DESModelRegions = const_cast<volScalarField&> ( mesh.lookupObject<volScalarField>(resultName_) ); if (mesh.foundObject<DESModelBase>(turbulenceModel::propertiesName)) { const DESModelBase& model = mesh.lookupObject<DESModelBase> ( turbulenceModel::propertiesName ); DESModelRegions == model.LESRegion(); scalar prc = gSum(DESModelRegions.internalField()*mesh.V()) /gSum(mesh.V())*100.0; file() << obr_.time().value() << token::TAB << prc << token::TAB << 100.0 - prc << endl; if (log_) Info << " LES = " << prc << " % (volume)" << nl << " RAS = " << 100.0 - prc << " % (volume)" << nl << endl; } else { if (log_) Info << " No DES turbulence model found in database" << nl << endl; } } } |
| References |
[1] P. R. Spalart, Detached-Eddy Simulation. Annual Review of Fluid Mechanics 41, 181-202, 2009.
