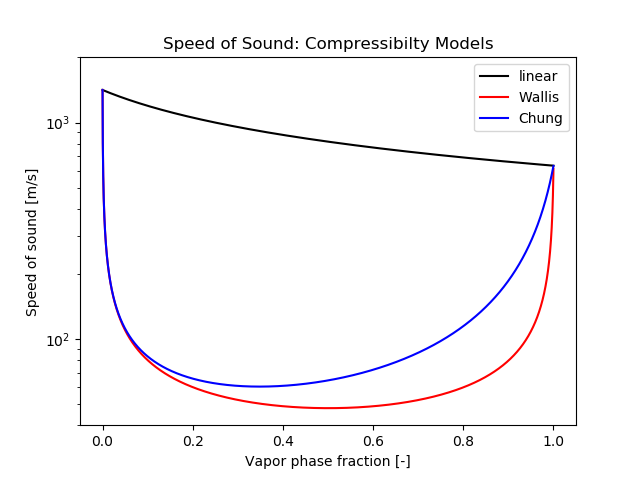
What We Want to Do
We want to plot the following three mathematical expressions in 2D that describe the speed of sound \(c\) as a function of a vapor fraction \(\gamma\).
\begin{align}
c = \frac{1}{\sqrt{\psi}}. \tag{1} \label{eq:psi-sos}
\end{align}
-
- linear
\begin{align}
\psi_{linear} = \gamma \psi_v + \left(1 – \gamma \right)\psi_l \tag{2} \label{eq:linear}
\end{align}
-
- Wallis
\begin{align}
\psi_{Wallis} = \left( \gamma \rho_{v, Sat} + \left( 1 – \gamma \right)\rho_{l, Sat} \right)
\left( \gamma \frac{\psi_v}{\rho_{v, Sat}} + \left( 1 – \gamma \right)\frac{\psi_l}{\rho_{l, Sat}} \right) \tag{3} \label{eq:wallis}
\end{align}
-
- Chung
\begin{align}
\psi_{Chung} = \left( \left( \frac{1 – \gamma}{\sqrt{\psi_v}} + \gamma \frac{s_{fa}}{\sqrt{\psi_l}} \right)\frac{\sqrt{\psi_v \psi_l}}{s_{fa}} \right)^2 \tag{4} \label{eq:chung}
\end{align}
where
\begin{align}
s_{fa} = \sqrt{ \frac{\frac{\rho_{v, Sat}}{\psi_v}}{\left( 1- \gamma \right)\frac{\rho_{v, Sat}}{\psi_v} + \gamma \frac{\rho_{l, Sat}}{\psi_l}} } \tag{5} \label{eq:chung-sfa}
\end{align}
For more details of the above expressions, you might want to read the following post.
Sample Code
|
1 2 3 4 5 6 7 8 9 10 11 12 13 14 15 16 17 18 19 20 21 22 23 24 25 26 27 28 29 30 31 32 33 34 |
import matplotlib.pyplot as plt import numpy as np # linear compressibility model def psi_linear(x): return x*psiv + (1 - x)*psil # Wallis compressibility model def psi_wallis(x): return (x*rhovsat + (1 - x)*rholsat)*(x*psiv/rhovsat + (1 - x)*psil/rholsat) # Chung compressibility model def psi_chung(x): sfa = np.sqrt((rhovsat/psiv)/((1 - x)*rhovsat/psiv + x*rholsat/psil)) return np.square(((1 - x)/np.sqrt(psiv) + x*sfa/np.sqrt(psil))*np.sqrt(psiv*psil)/sfa) # User inputs psiv = 2.5e-06 psil = 5.0e-07 rhovsat = 1.2 rholsat = 830 gamma = np.arange(0, 1, 1e-04) plt.title('Speed of Sound: Compressibilty Models') plt.xlabel('Vapor phase fraction [-]') plt.ylabel('Speed of sound [m/s]') plt.ylim(40, 2000) plt.yscale('log') plt.plot(gamma, 1/np.sqrt(psi_linear(gamma)), color="black", linewidth=1.5, label='linear') plt.plot(gamma, 1/np.sqrt(psi_wallis(gamma)), color="red", linewidth=1.5, label='Wallis') plt.plot(gamma, 1/np.sqrt(psi_chung(gamma)), color="blue", linewidth=1.5, label='Chung') plt.legend(loc='best') plt.show() |